

A Shock Test Facility to Replicate Launch Conditions
The Manufacturing and Testing of a SHOCK TEST FACILITY
A project that revolves itself around the investigation and characterisation of shock phenomena in specific engineering scenarios. The scenarios under consideration are contained very prominently within spacecraft and aerospace industries. During the launch/ flight sequence of an aircraft, there exists a multitude of flight stages in which pyrotechnic shock is generated.
These particular forms of shock hold the capacity to completely dismantle the success of missions. The high frequency propagation excitation associated with pyrotechnic shock has been known to abolish the functionality of imperative flight equipment within the payload of spacecraft. Consequentially, discerning a comprehensive understanding of pyrotechnic shock for companies has become a fundamental priority in both mitigating against its inherently destructive nature and attaining the ability to shock test equipment, ensuring their proficiency in withstanding flight conditions.
The Finalised Design


An extensive literature review was carried out to inspire the design of a Shock Test Facility optimised in carrying out an experimental procedure capable of replicating the shock levels experienced in space.
The procedure was designed as a form of Point Pyroshock Source Simulator with a tuned resonant fixture attached to a base plate (fixed to a rack). The pyrotechnic shock simulation technique utilises the excitation capabilities of the Single state gas gun.

A cylindrical steel projectile (depicted below) would be fired at a pre-determined velocity controlled by the Single state gas gun bar. From this point the Dynamic loading response would be recorded from 2 accelerometers at equidistance from the point source.
Experimental Procedure
In carrying out the experimental procedure, three fundamental parameters relating to the acceleration response were outlined as variables. Using these three parameters an experimental procedure was constructed to provide an effective analysis of the acceleration response for the pyrotechnic simulation technique. The three parameters investigated in the numerical simulations were adjusted to fine tune the SRS slope to the required test levels, these include:
- The configuration/position of the accelerometers
- The material of the projectile impacting the resonator
- The velocity of the projectile impacting the resonator
In investigating the effect of each of the parameters, all the other parameters were kept constant and the parameter under analysis was altered incrementally. The configuration of the accelerometers was varied through three different locations. On the LHS the accelerometer is attached to the tip of the response plate. On the RHS the accelerometer is attached directly to the aluminium sheet.
The experimental procedure was made up of a number of sequential stages. After the apparatus was bolted to the rack in the experimental room, the gas gun was loaded with a projectile and a response plate was attached to the first configuration position he room of the gas gun was exited by the technician, student and project officer. The mesh door inclosing the gun and apparatus was locked, ensuring all personal were protected from ricochet of the bullet. The DAQ software was set to record and the recording software connected to the barrel of the gas gun was readied.
The pressure valves on the Hopkins pressure bar controller were pre-set, the pressure values were varied depending on the velocity required for the excitation. The projectile was then fired and the shock response recorded from the accelerometer attached to the aluminium base plate. With each accelerometer configuration the velocity was varied at three increments. Each velocity increment was repeated to ensure anomalies in the experiment were marginalised. After data was acquired for each velocity increment the material of the bullet was altered from plastic to steel (or visa-versa) and the process was repeated.
Results
Configuration 1
The experimental procedure began with the utilisation of the plastic projectile with the accelerometer in configuration 1. Whilst the projectile material was kept constant the measurement location was relocated. The results at 3 velocity increments are displayed below, with the acceleration time response of the response plate
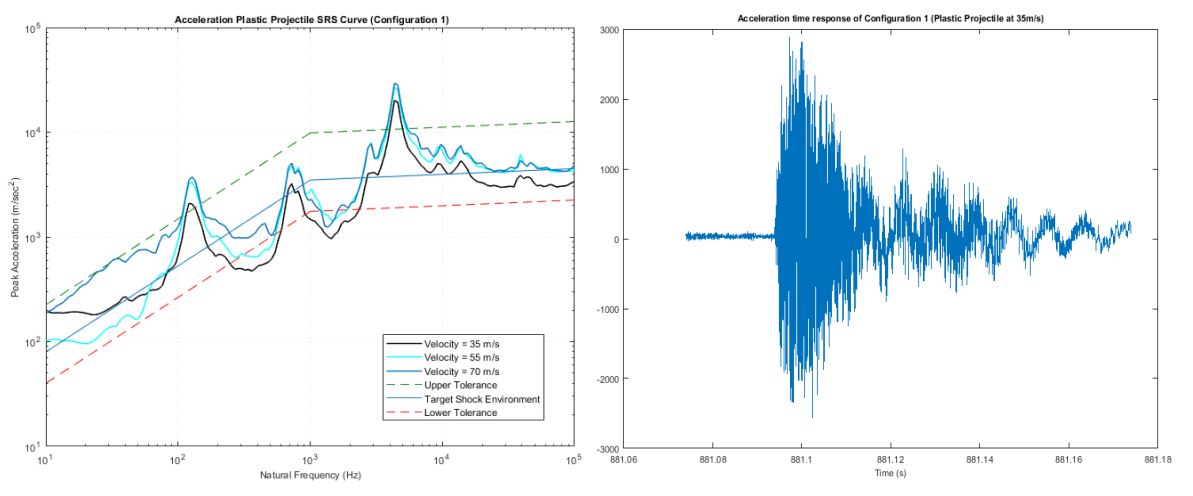
Given the test levels outlined previously in the chapter. The SRS curves of in the first configuration provide good approximations of the required test levels for spacecraft. The slopes adhere to the NASA pyrotechnic shock criteria, with 50% of the data points lying within the tolerance bands. Despite this the knee frequency of the shocks occurs at an unexpectedly high acceleration (at 3.5 kHz). In the acceleration/ time curve there is a notable second oscillation that occurs after the high acceleration component of the shock transpires. This can be attributed to vibrations of the response plate. These oscillations give rise to the unusual low ends of the SRS curve (below 100 Hz). The comparisons in the SRS curves show that increases in velocity give rise to an increase in the shock level (a shift in the y direction). A trend deduced from the numerical simulation investigations.
Configuration 2
The results displayed above highlight the SRS response for the second accelerometer position. Initially, at high velocity, the knee frequency’s appeared out of the tolerance range. In applying knowledge acquired from the previous results. The shock levels were shifted to fit within the tolerance band by reducing the velocity of the projectile, this tuning procedure gave rise to a more appropriate shock response. This highlighted that 35 m/s was the ideal velocity to achieve the test level criteria.

The results displayed above highlight the SRS response for the second accelerometer position. Initially, at high velocity, the knee frequency’s appeared out of the tolerance range. In applying knowledge acquired from the previous results. The shock levels were shifted to fit within the tolerance band by reducing the velocity of the projectile, this tuning procedure gave rise to a more appropriate shock response. This highlighted that 35 m/s was the ideal velocity to achieve the test level criteria.
Configuration 3
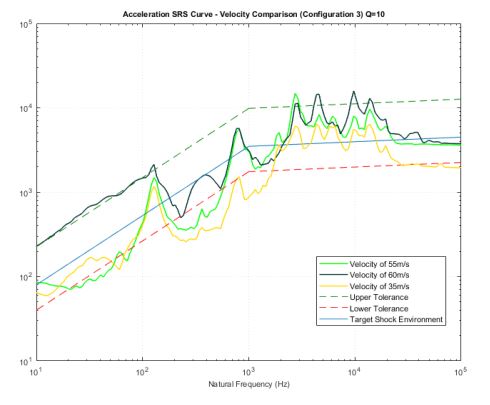
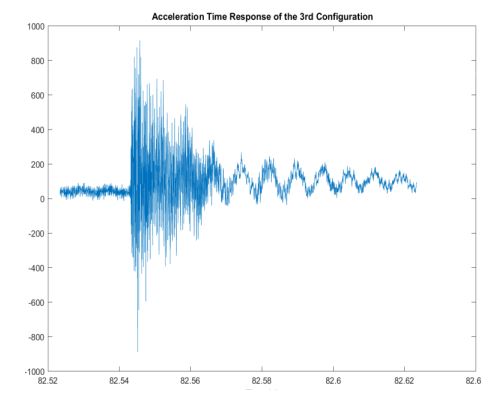
The results for the third configuration however, showed a different optimal velocity. With an increase in the distance from the test location the shock level decreases (at a constant velocity). The shock level displayed at 35 and 55 m/s is below the optimised velocity. Increasing the velocity to 60 m/s gave rise to the optimal SRS response.
Configuration Comparison
Each of the three configurations were evaluated at 35 m/s. The first configuration detected an SRS response with a knee frequency above the upper tolerance bands, whereas the third configuration displayed a curve below the lower tolerance band. At 35 m/s the 2nd configuration displayed the most optimal SRS response. The other two configurations require tuning of the SRS response through incremental adjustments of the velocity or a change in projectile material.
Comparing the SRS curves:

Comparing the Acceleration time response:
