
Investigating International Energy Datasets
Introduction
This project looked at 3 publically available datasets associated with international energy consumption.
The first dataset contains a list of indicators for energy supply and renewable electricity production from the United Nations from the year 2013.The second dataset is an international record from the World Bank containing countries’ GDP from 1960 to 2015. The third contains records of the Sciamgo Journal and Country Rank for Energy Engineering and Power Technology. This ranks countries based on their journal contributions with regards to areas mentioned in the previous sets.
After the data was organised and cleaned, through the construction and answering of questions regarding the datasets I was able to investigate the data in greater detail and answer key questions regarding energy supply, renewable energy usage and GDP levels internationally.
Reorganisation and Cleaning
Dataset 1
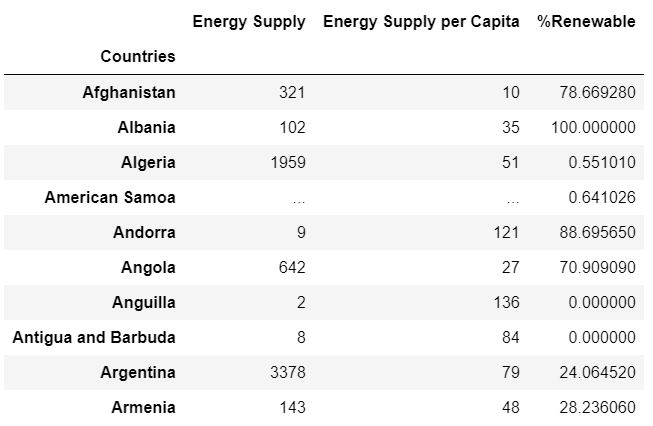
The first dataset was imported and the header and footer of the file were removed.
import pandas as pd
import numpy as np

Energy = pd.read_excel('Energy Indicators.xls', skiprows=17, skipfooter=38)
The first 10 countries in the list were as follows:
To achieve this extra lines of code were implemented:
-
The columns were renamed to the relevant subcategories
-
The country column was set as the index
-
The columns were renamed to the relevant subcategories and the redundant columns were deleted
-
The Energy supply was converted from gigajoules and the data type converted to float64
Energy = Energy.rename(index=str, columns={"Unnamed: 2": "Countries", "Petajoules": "Energy Supply", "Gigajoules": "Energy Supply per Capita", "%": "%Renewable"})
Energy['Energy Supply'] = Energy['Energy Supply'].apply(lambda x: x*1000000000)
Energy = Energy.set_index(['Countries'])
Energy = Energy.drop(Energy.columns[[0, 1]], axis=1)
Energy['Energy Supply'].astype('float64')
- Next the data was cleaned to ensure the country names were coherent to the other datasets.
Dataset 2
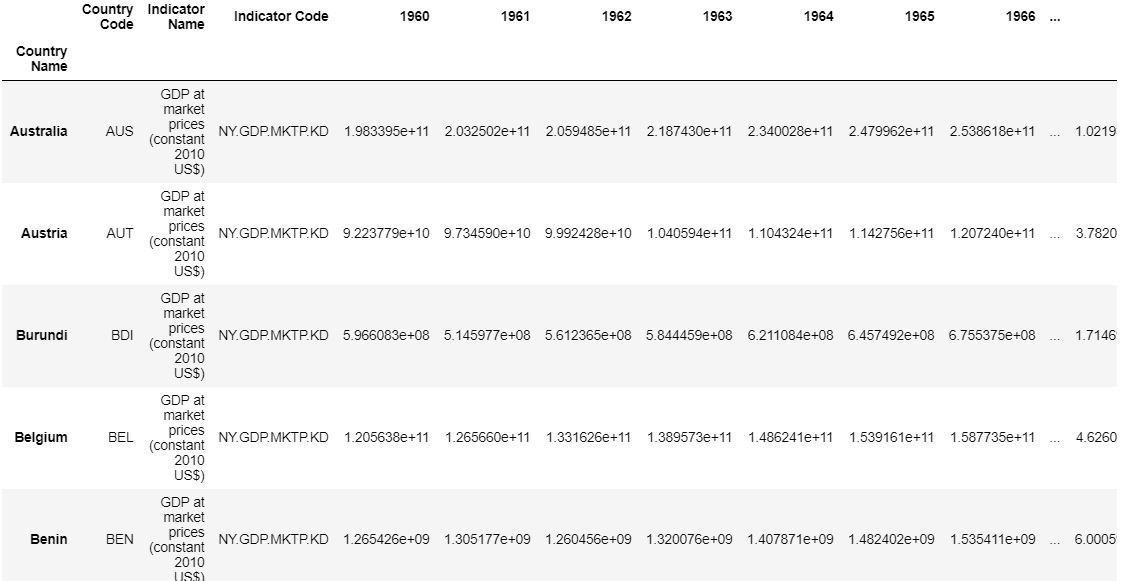
The second dataset from the world bank was imported containing international GDP levels.
Likewise as with the first set:
-
The header was bypassed
-
Inconsistencies in the country labels were rectified
-
The country column was set as the index
-
NaN cells were then dropped from the dataset
import pandas as pd
GDP = pd.read_csv('world_bank.csv', skiprows=4)
GDP = GDP.rename({"Hong Kong SAR, China": "Hong Kong", "Iran, Islamic Rep.": "Iran", "Korea, Rep.": "South Korea"})
GDP = GDP.set_index(['Country Name'])
GDP = GDP.dropna()
Outputting the first 5 elements of the GDP data set:
Dataset 3
The last dataset containing published records of countries’ contribution to renewable and sustainable projects was then imported.
It was then reorganised and filtered in the following way:
-
The country column was indexed
-
The top 15 ranked countries were then queried
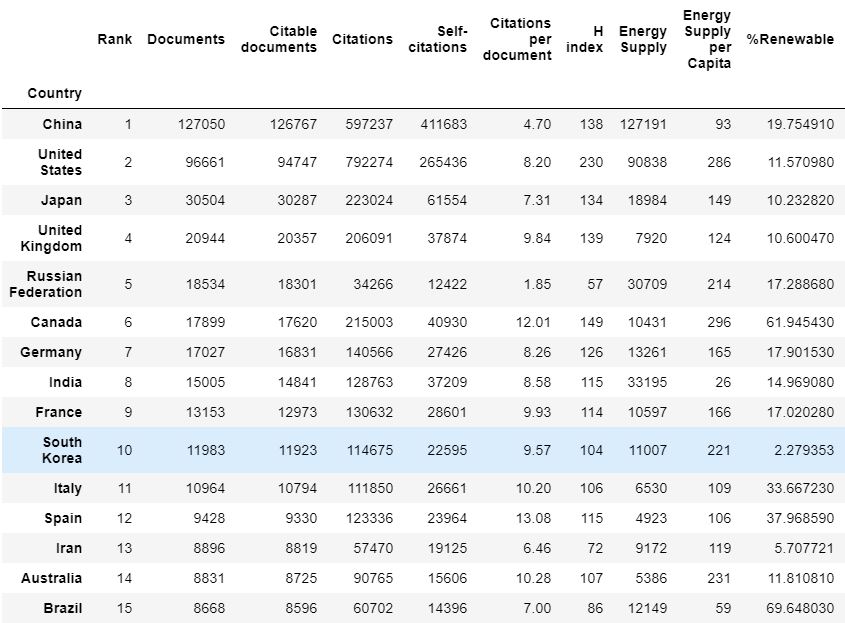
ScimEn = pd.read_excel('scimagojr-3.xlsx')
ScimEn = ScimEn.set_index(['Country'])
ScimEn = ScimEn[(ScimEn['Rank'] < 16)]
With the first 15 elements of the Scimajr dataset as follows:

Merging the Data Sets
To execute beneficial analysis on the data it was necessary to merge all three of the sets to yield data cohesive for all three of the files, this was achieved using pandas merge function sequentially.
Firstly the energy dataset was merged to output the intersection of both the datasets (using pandas pd.merge and setting ‘how’ to ‘inner’) the ‘Country’ index was.
This was then repeated. The first merged set was combined with the scimajr set to yield a combination of all three sets.
Merged = pd.merge(Energy, GDP, how='inner', left_index=True, right_index=True)

secondMerged = pd.merge(Merged, ScimEn, how='inner', left_index=True, right_index=True)

columns_to_include = ['Rank', 'Documents', 'Citable documents', 'Citations', 'Self-citations',
'Citations per document', 'H index', 'Energy Supply', 'Energy Supply per Capita', '%Renewable', '2006', '2007', '2008', '2009',
'2010', '2011', '2012', '2013', '2014', '2015']

Combined = secondMerged[columns_to_include]
Combined = Combined.rename(index=str, columns={' ': 'Country'})
Combined = Combined[(Combined['Rank'] < 16)]
A1 = Combined[(Combined['Rank'] < 16)]
The first 15 countries of the merged set, in order of rank, were as follows:
Data Investigation
How Many Countries Were lost in the Creation of the New Data Set?
This can be calculated by creating a new set with the union of all the data (by using ‘how’ and ‘outer’ sequentially).
The length of this set is calculated, and the length of the 1st merged set (containing the intersection of all three datasets) is subtracted.
Merged2 = pd.merge(Energy, GDP, how='outer', left_index=True, right_index=True)
Merged3 = pd.merge(Merged2, ScimEn, how='outer', left_index=True, right_index=True)

Merged4 = pd.merge(GDP, Energy, how='inner', left_index=True, right_index=True)
Merged5 = pd.merge(Merged4, ScimEn, how='inner', left_index=True, right_index=True)

A2 = len(Merged3)-len(Merged5)
Outputting a value of 173.
What is the Average GDP over the past 10 Years for each country?
Here it was necessary to output a panda series including the average GDP of the 15 countries over the last 10 years.
To achieve this, a new column was created with each of the countries average GDP over the last 10 years.
Within Iran’s ‘2015’ GDP data there existed a NaN output. To exclude this from the calculations the median GDP (based on other values) was taken for ‘2015’ and the mean GDP was calculated.
Top15 = A1
Col = ['2015']
Top15[Col] = Top15[Col].fillna(Top15[Col].median())
The necessary calculation was then computed and outputted to a new column.
This was then converted to a pandas series and ordered from highest to lowest.
Top15['avgGDP'] = ((Top15['2006'] + Top15['2007'] + Top15['2008'] + Top15['2009'] + Top15['2010'] + Top15['2011'] + Top15['2012'] + Top15['2013'] + Top15['2014'] + Top15['2015']) / 10)

[columns_to_keep] = ['avgGDP'] %Eliminating all columns aside from the avgGDP

A3 = Top15[columns_to_keep]
A3 = pd.Series(Top15['avgGDP'])

A3.sort('avgGDP', ascending=False)
Outputting the following series:

For the country with the 6th largest GDP, how much did the GDP change over 10 years?
To find this it again necessary to create a new column. This time its necessary to find the minimum and maximum value for the 6th country (which appeared to be the United Kingdom from the previous question) and subtract the maximum value from the minimum.
This was done for all of the countries and the “loc” function was used to isolate the UK.
Top15 = answer_one()
Col = ['2015']
Top15[Col] = Top15[Col].fillna(Top15[Col].median())

Top15 = Top15[['2006', '2007', '2008', '2009', '2010', '2011', '2012', '2013', '2014', '2015']].astype(np.float64)

Top15['absolute_difference'] = abs(Top15['2015']-Top15['2006'])

[columns_to_include] = ['absolute_difference']

Top15 = Top15['absolute_difference']

A4 = Top15.loc['United Kingdom']
The difference was found to be $299,285,784,765.
What is the Mean Energy Supply per Capita?
Total = Top15['Energy Supply per Capita'].sum()

MeanEnergy = Total / 15

return MeanEnergy
Which yielded a value of 157.6 Gigajoules.
Which country has the maximum ‘% Renewable’ and what is the percentage?
Here the argmax() function is used to determine the index value with the highest Value.
MaxEnergy = Top15['% Renewable'].argmax()

MEV = max(Top15['% Renewable'])

MaxList = [MaxEnergy, MEV]

A6 = tuple(MaxList)
Outputting Brazil, with 69%
If a new column is created with a ratio of Self-citations to Total-citations, what is the maximum value for this new column and what country has the highest ratio? (must output a tuple)
Top15 = answer_one()
Top15['Ratio of Self to Total'] = Top15['Self-citations'] / Top15['Citations']
MaxRatio = Top15['Ratio of Self to Total'].argmax()
MRV = max(Top15['Ratio of Self to Total'])
A7 = tuple([MaxRatio, MRV])
A7
Outputting a tuple with a string value of China with a value of 0.689.
Estimate the population of all of the countries.
What is the third most populous country according to this estimate?
After converting the data type to float a new column was created with a population estimate.
The values were sorted from highest to lowest, and the first two values were dropped.
Top15 = Top15.astype(np.float64) %Converting data type to float

Top15['Population Estimate'] = Top15['Energy Supply'] / Top15['Energy Supply per Capita']

Sorted = Top15.sort_values(by=['Population Estimate'], ascending=False)

[columns_to_keep] = ['Population Estimate']

A8 = Sorted[columns_to_keep]

A8 = A8.drop(["China", "India"])

A8 = A8.argmax()
Outputting a string value of ‘United States’.
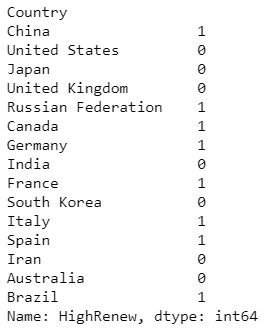
Create a list with a binary representation indicating if the countries ‘% Renewable’ value is above or below the median value.
Top15['HighRenew']=np.where(Top15['% Renewable']>=Top15['% Renewable'].median(),1,0)

HighRenew=Top15.sort_values(by='Rank')['HighRenew']
Outputting the following series: