
Jet Engine Analysis
Turbofan VS Turbojet
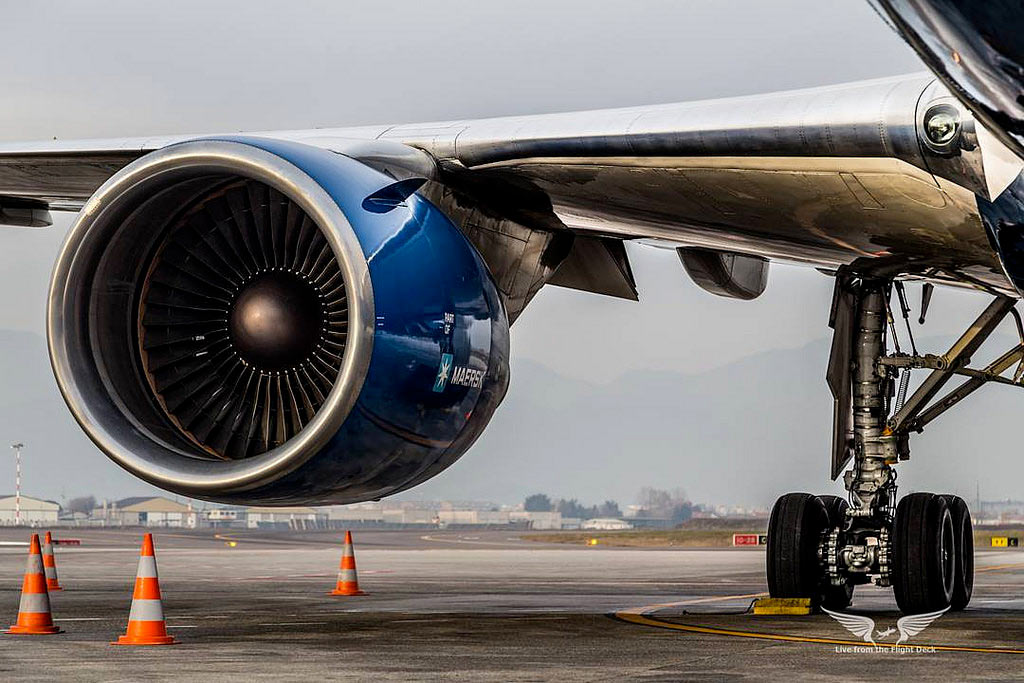
There are six main types of jet engine. The image above depicts a turbofan, employed mainly for commercial use based on its optimal efficiency levels between a Mach number of 0.8 and 0.9. A turbofan operates almost identically to a turbojet but with a portion of the air partitioned from the inlet. For the same thrust a turbofan will provide a reduced fuel consumption.
A turbofan emits a larger amount of air at slower rate, whilst a turbojet exhausts a smaller amount of air at a faster rate, leading to a knock down effect on the efficiency of the engine. Despite this however, a disparity in efficiency is slowly reversed as the Mach number increases. A fundamental reason for engineers behind supersonic aircraft (such as the Concorde or Bristol type 223) opting for turbojet engines as an alternative to turbofans or turboprops. The main body of the analysis in this post is concerned with the performance of a Turbojet, in particularly the AMT Olympus Turbojet.
How does a Turbojet Engine Work ?

By Jeff Dahl, CC BY-SA 4.0, Link
The components of a gas turbine engine work sequentially with each other to generate thrust. The components include the inlet, the compressor, the combustion chamber, the turbine, and the nozzle. Each stage of the engine is engineered specifically to maximise the thrust output from the engine.
Inlet
The process is commenced firstly with air intake through the inlet. For low speed aircraft a key main responsibility of an inlet is to maximise the volume of air admitted into the engine whilst ensuring directionally smooth airflow into the compressor. Despite this, an inlet must also be designed for optimal efficiency across the entirety of an aircrafts flight envelope. At the start of an aircrafts take off sequence the inlet acts as an intake for air, but at high speeds an optimal inlet allows an aircraft to maneuver to high angles of attack without disrupting intake to the compressor. Because of its bearing on aircraft performance, the inlet is often designed by the company in charge of the airframe instead of the engine manufacturers.
Compressor
As the name indicates, the next stage is designed to compress the air taken in through the inlet, thereby increasing the pressure through reducing the volume to a fraction of its initial value (resulting in an increase in internal energy). The compressor is perpetually spinning due to energy transfers from the turbine to the central shaft.
Combustor
As compressed air leaves the compressor it is mixed with fuel and ignited in the combustor, the internal energy of the compressed air, as well as the energy gain from the combustion process, both contribute to a vast gain in energy with regards to the overall system. The products of the reaction are then exhausted through the combustion chamber and into the turbine.
Turbine
In the first stage, the rotation of the turbine is largely down to the impact of the high energy products of the combustion, hence is often referred to as an impulse turbine. Energy is transferred to the central shaft by a momentum transfer that mirrors the energy transfer in the compressor but in reverse. The shaft power harnessed by the turbine is employed to rotate the compressor.
Nozzle
The nozzle is the component of the engine that converts the internal energy of the working gas into propulsive force. The power setting of the engine dictates the speed to which the nozzle accelerates the air (supersonic, subsonic or transonic) as well as the pressure values at the entry and exit.
The investigation
Aims and Objectives
The principle objective of this experiment was to discern the overall performance levels of an AMT Olympus turbojet engine. This was achieved through analysing the performance and component efficiencies at various flight stages. These corresponded to fundamental points within a jet cycle. These results were juxtaposed with those of typical larger scale gas turbine engines.
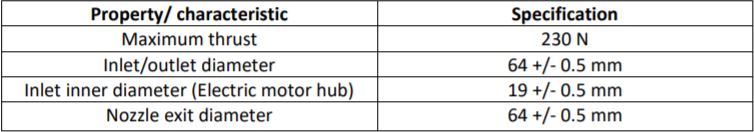
The specification of the engine is dipicted in the table below.
The test procedure was carried out in a way that would test the engine at various conditions, namely: idle power, approach power, climb power and take off/go around power.
The equipment was initialised from an engine cold-start. During the first run, communication on what throttle percentages were to be targeted for each increment in ‘phase’ of flight. The ‘Test and Data Recording’ for the cold start was the same as the hot start procedure, no test was carried out before the cold start. in addition, throttle increments were random due to the communication issue. This did not have a major impact on the results, albeit the ‘phases’ of flight were not consistent with a hot engine start.
Experimental procedure
Two tests were to be performed with four identical setting values for the throttle. The total fuel consumed was calculated to be around 1.308 litres where the idle fuel was extrapolated from existing data. This assumed that the additional amount of fuel equal to the fuel used for an average throttle between the two intervals. This was a good assumption as the fuel was calculated for the midpoint between the two intervals for 10 seconds but it took less than 10 seconds to adjust the throttle. Instead of adding an additional test point we agreed to keep the fuel used below the 1.5 litres to limit to accommodate for inefficiency and potential mistakes or longer transition time between intervals than the ten seconds assumed. The chosen throttle settings were based on actual operational conditions of an aircraft: 0% at the gate, 80% at cruise and 100% at take-off. 40% was chosen as a mid-range value for landing and to create a more comprehensive analysis.
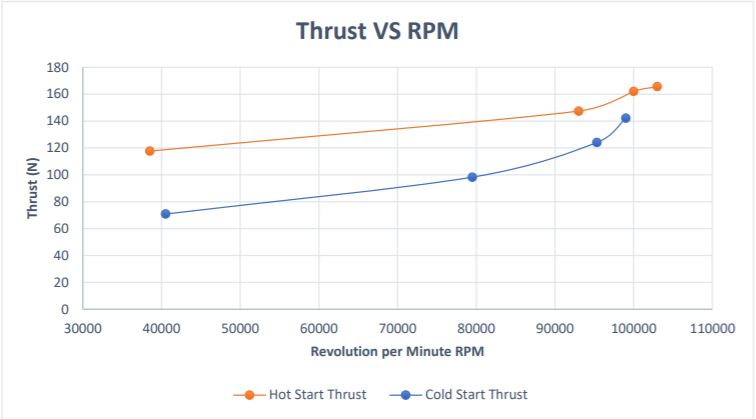
At each test condition, ten consecutive real-time values were recorded for each parameter measured (gauge pressure, fuel flow rate, thrust consumed, EGT and RPM) using the DAQ system/LabView software and the related sensing hardware. This was essential in order to analyse the results. The same throttle setting values were chosen for the second test in order to compare the engine performance at ‘cold start’ and ‘hot start’ conditions. The ‘hot start’ conditions were achieved by taking readings before the engine had time to cool shortly after operating at 100% throttle consequently the second test would begin at a higher temperature.
Experimental Results
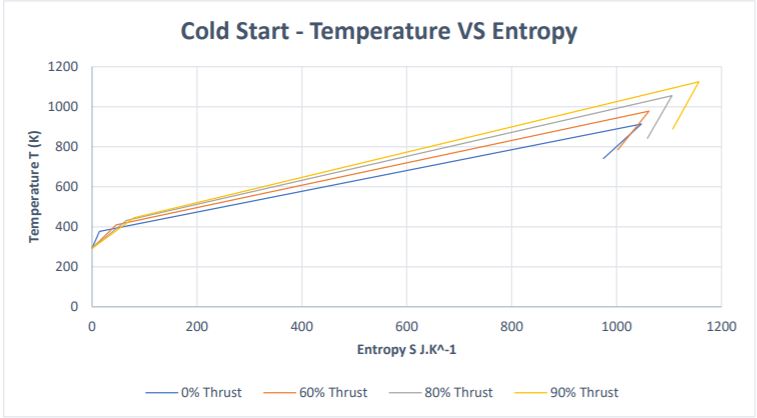
To determine the change in temperature with entropy the following formula was utilised.